

Observability & monitoring
How to monitor a script that runs forever (a daemon) or on a schedule (cron), at homelab / small-startup scale — what the tools actually are, what real setups use, and a base template to start from. Grounded in real writeups (see Further reading), not vendor decks.
Alert delivery is a swappable leaf, not the hub. Every quality writeup routes alerts to a receiver you can change (ntfy, Slack, Discord, email, Gotify, Telegram, PagerDuty) behind Alertmanager / Shoutrrr / a tool's own integrations. Pick the collector and store deliberately; the channel is a one-line config. Diagrams below say "notify" — substitute whatever you like.
Acronyms & jargon (click to expand)
- IOPS — disk I/O operations per second (throughput in ops, not bytes).
- TSDB — time-series database (stores metrics over time).
- SaaS — software-as-a-service (a vendor hosts it; your data leaves the box).
- PromQL / APL — the query languages of Prometheus / Axiom.
- OpenTelemetry (OTel) / OTLP — vendor-neutral standard + wire protocol for logs, metrics and traces.
- APM — application performance monitoring (latency / error rate / throughput of your app's own code).
- ML anomaly — machine-learning detection of "this looks abnormal vs the usual pattern".
- WAL — write-ahead log (an append-only durability log; it's why Loki's alert ruler can miss evaluations).
- node_exporter / cAdvisor — the standard agents that expose a Linux host's / containers' metrics for Prometheus to scrape.
- Alertmanager — Prometheus's separate alert router (groups, silences, dedupes, routes to receivers).
- journald — systemd's built-in log store, queried with
journalctl. - Shoutrrr — a library giving one URL syntax for many notify backends (Beszel uses it).
- PocketBase / ClickHouse / SQLite — the embedded / columnar datastores these tools keep their data in; you rarely touch them directly.
Contents
- The reframe — three problems, not one
- What real homelab setups actually run
- The two core architectures
- The base template (tiers)
- The tools, with pictures
- What the metrics look like (CPU over time)
- Dashboards — look vs be told
- NixOS recipe
- Avoid
- TL;DR — what should I actually do?
- Further reading
The reframe — three problems, not one
A "monitoring" need is really three failure questions, each needing a different tool:
The first is the highest-value and most-skipped: a CPU graph looks identical whether your cron ran or never fired. Only a heartbeat turns "nothing happened" into an alert.
Purple = the liveness path metrics can't see. Grey = the notify channel — swappable; same colours mean the same thing in every diagram below.
What real homelab setups actually run
Five real writeups (2023–2026) solving close to this problem:12345
Two patterns dominate, chosen by what you're watching: a pull-based metrics stack (Prometheus + Grafana family) for host/container resources, and a push-based heartbeat (Healthchecks-style) for "did my job run". For a cron job or long-running script, the heartbeat is the direct fit; the metrics stack is what people layer on once they have several hosts/containers. Lighter single-purpose tools — Beszel, Uptime Kuma, Netdata — show up repeatedly for people who find the full stack too heavy, often run alongside it rather than instead.
So what: Don't copy the 9-service Grafana stack for a single cron job — that's the common over-build. Start with a heartbeat; add a metrics tool when host resources become a real question; treat the alert channel as a leaf you swap freely.
The two core architectures
Pull-based metrics stack — the box exposes numbers, a scraper pulls them on a schedule:
Push-based heartbeat — the job announces itself; absence is the alarm:
So what: Pull suits always-on hosts on a known network; push suits scheduled/ephemeral work — and a cron job is inherently push (it announces "I ran"), which is why a scrape-based stack structurally can't tell you it never started.
The base template (tiers)
Match the tier to the question you actually have. "notify" = your channel of choice.
So what: Ship Tier 0 + Tier 1 on every box (an afternoon); add 2 and 3 per-box only when a real question appears. systemd can't detect its own absence (it dies with the box) — that's why Tier 1 is a separate external witness.
The tools, with pictures
What each option actually is, how its data flows, and what its UI looks like. Screenshots are from each project's own site/docs (see Further reading for sources).
Uptime Kuma — liveness + status pages (self-host)
Define monitors (HTTP/TCP/ping/DNS, or a push type for cron jobs); Kuma probes on a schedule or receives heartbeats, stores results in SQLite, shows a live dashboard + public status page, and fires 90+ notification integrations on state change.
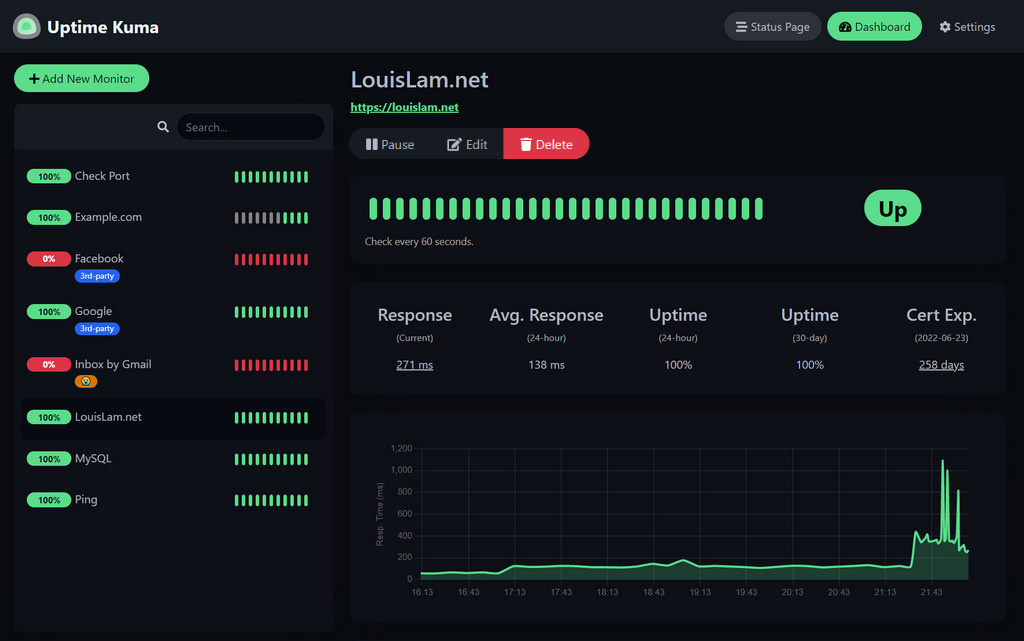 Dashboard: each monitor's uptime and response time at a glance.
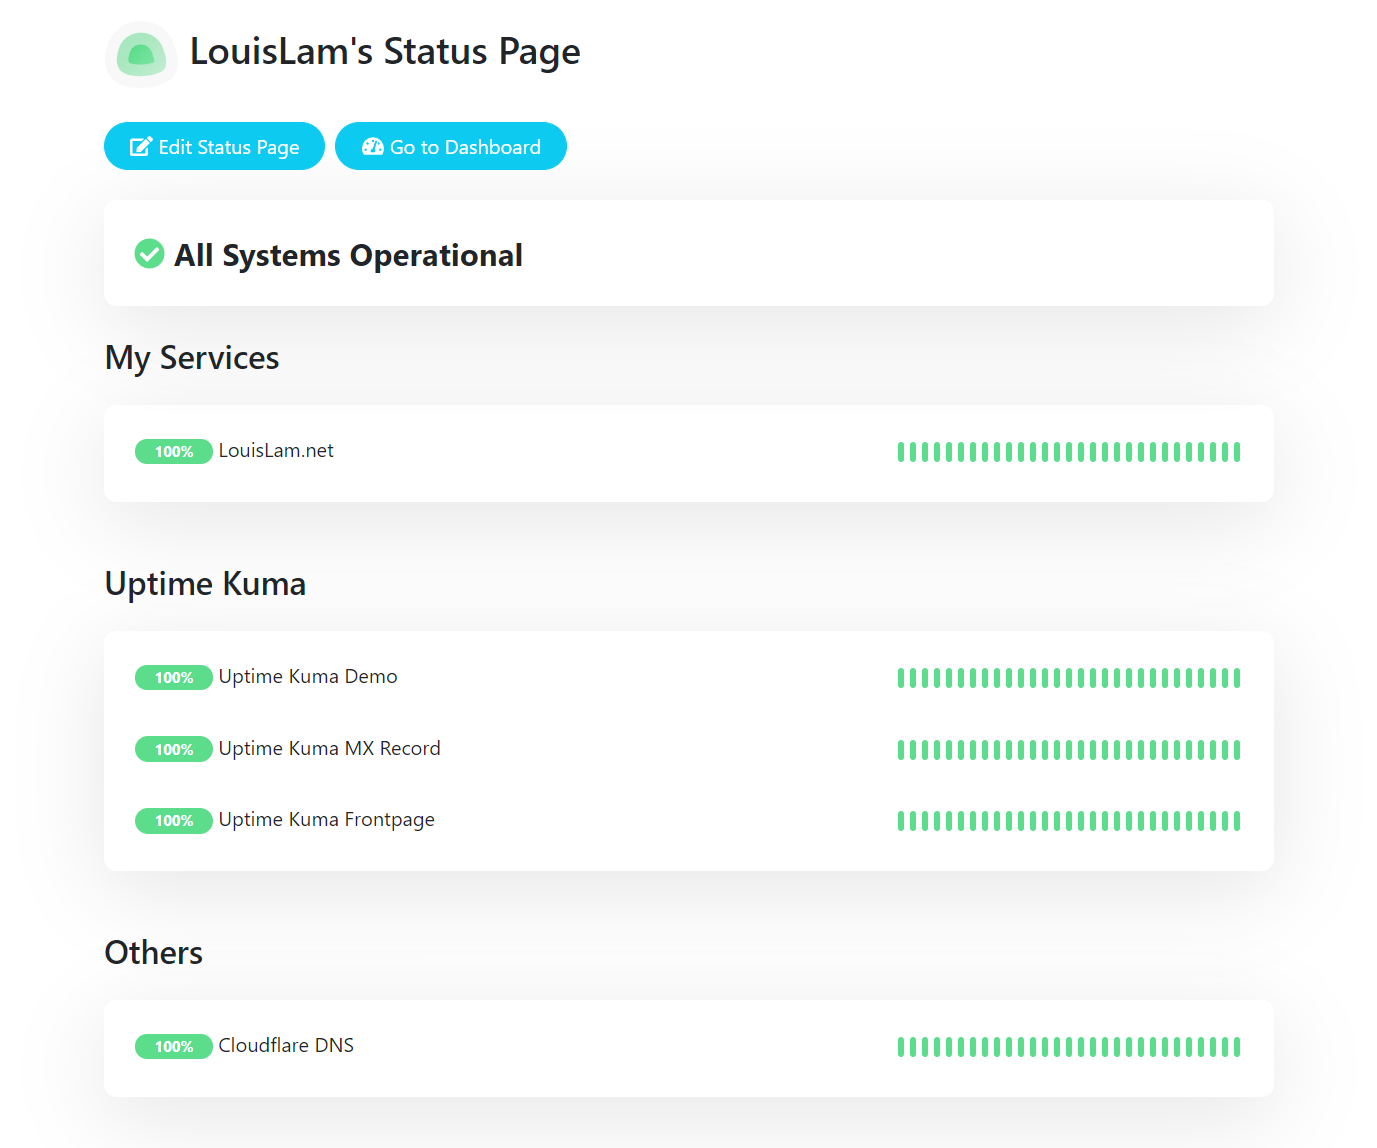 A published status page — services and their up/down state.
Healthchecks.io — the cron dead-man's-switch (self-host or free SaaS)
Purpose-built heartbeat monitor: each check has a ping URL; your job curls it on success. If a ping doesn't arrive within period + grace, the check goes down and notifies. This is the one tool that catches "the cron never ran".
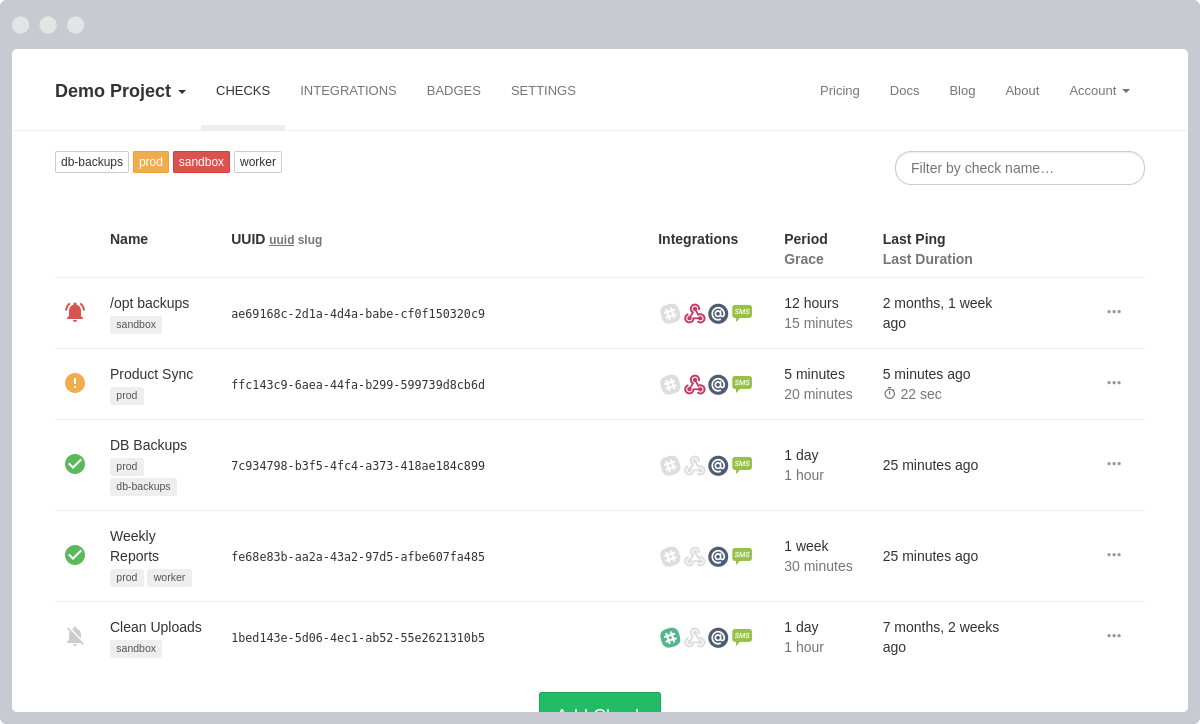 The checks list — each background job's status, period and last ping.
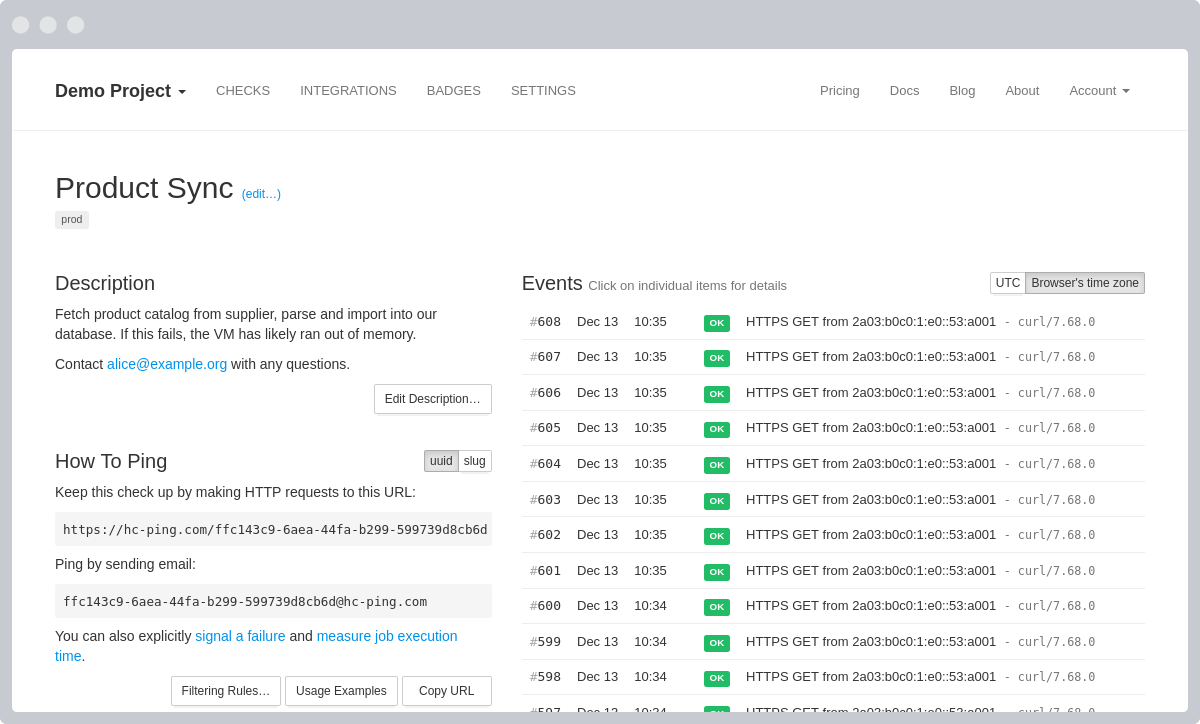 A single check's detail + live event log.
Beszel — lightweight metrics (self-host)
The "new lightweight" pick: a ~10 MB agent per host reads CPU/mem/disk-I/O/net/containers and reports to a small hub (PocketBase + SQLite) that draws the dashboard and evaluates threshold alerts (CPU/mem/disk/temp/status). The middle ground between Uptime Kuma and a Grafana/Prometheus build.
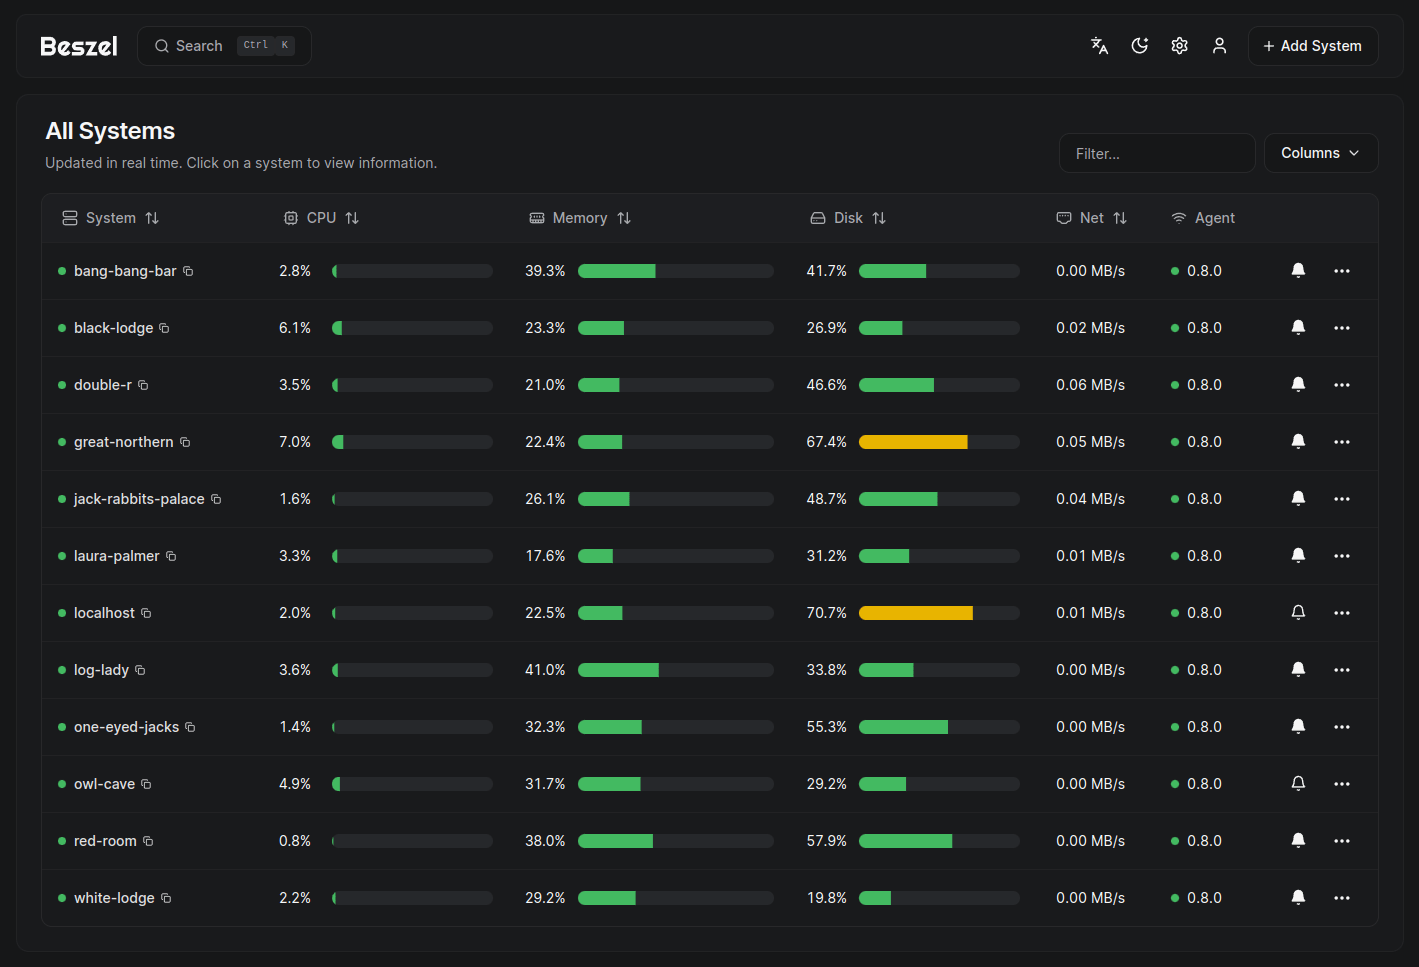 Multi-system overview.
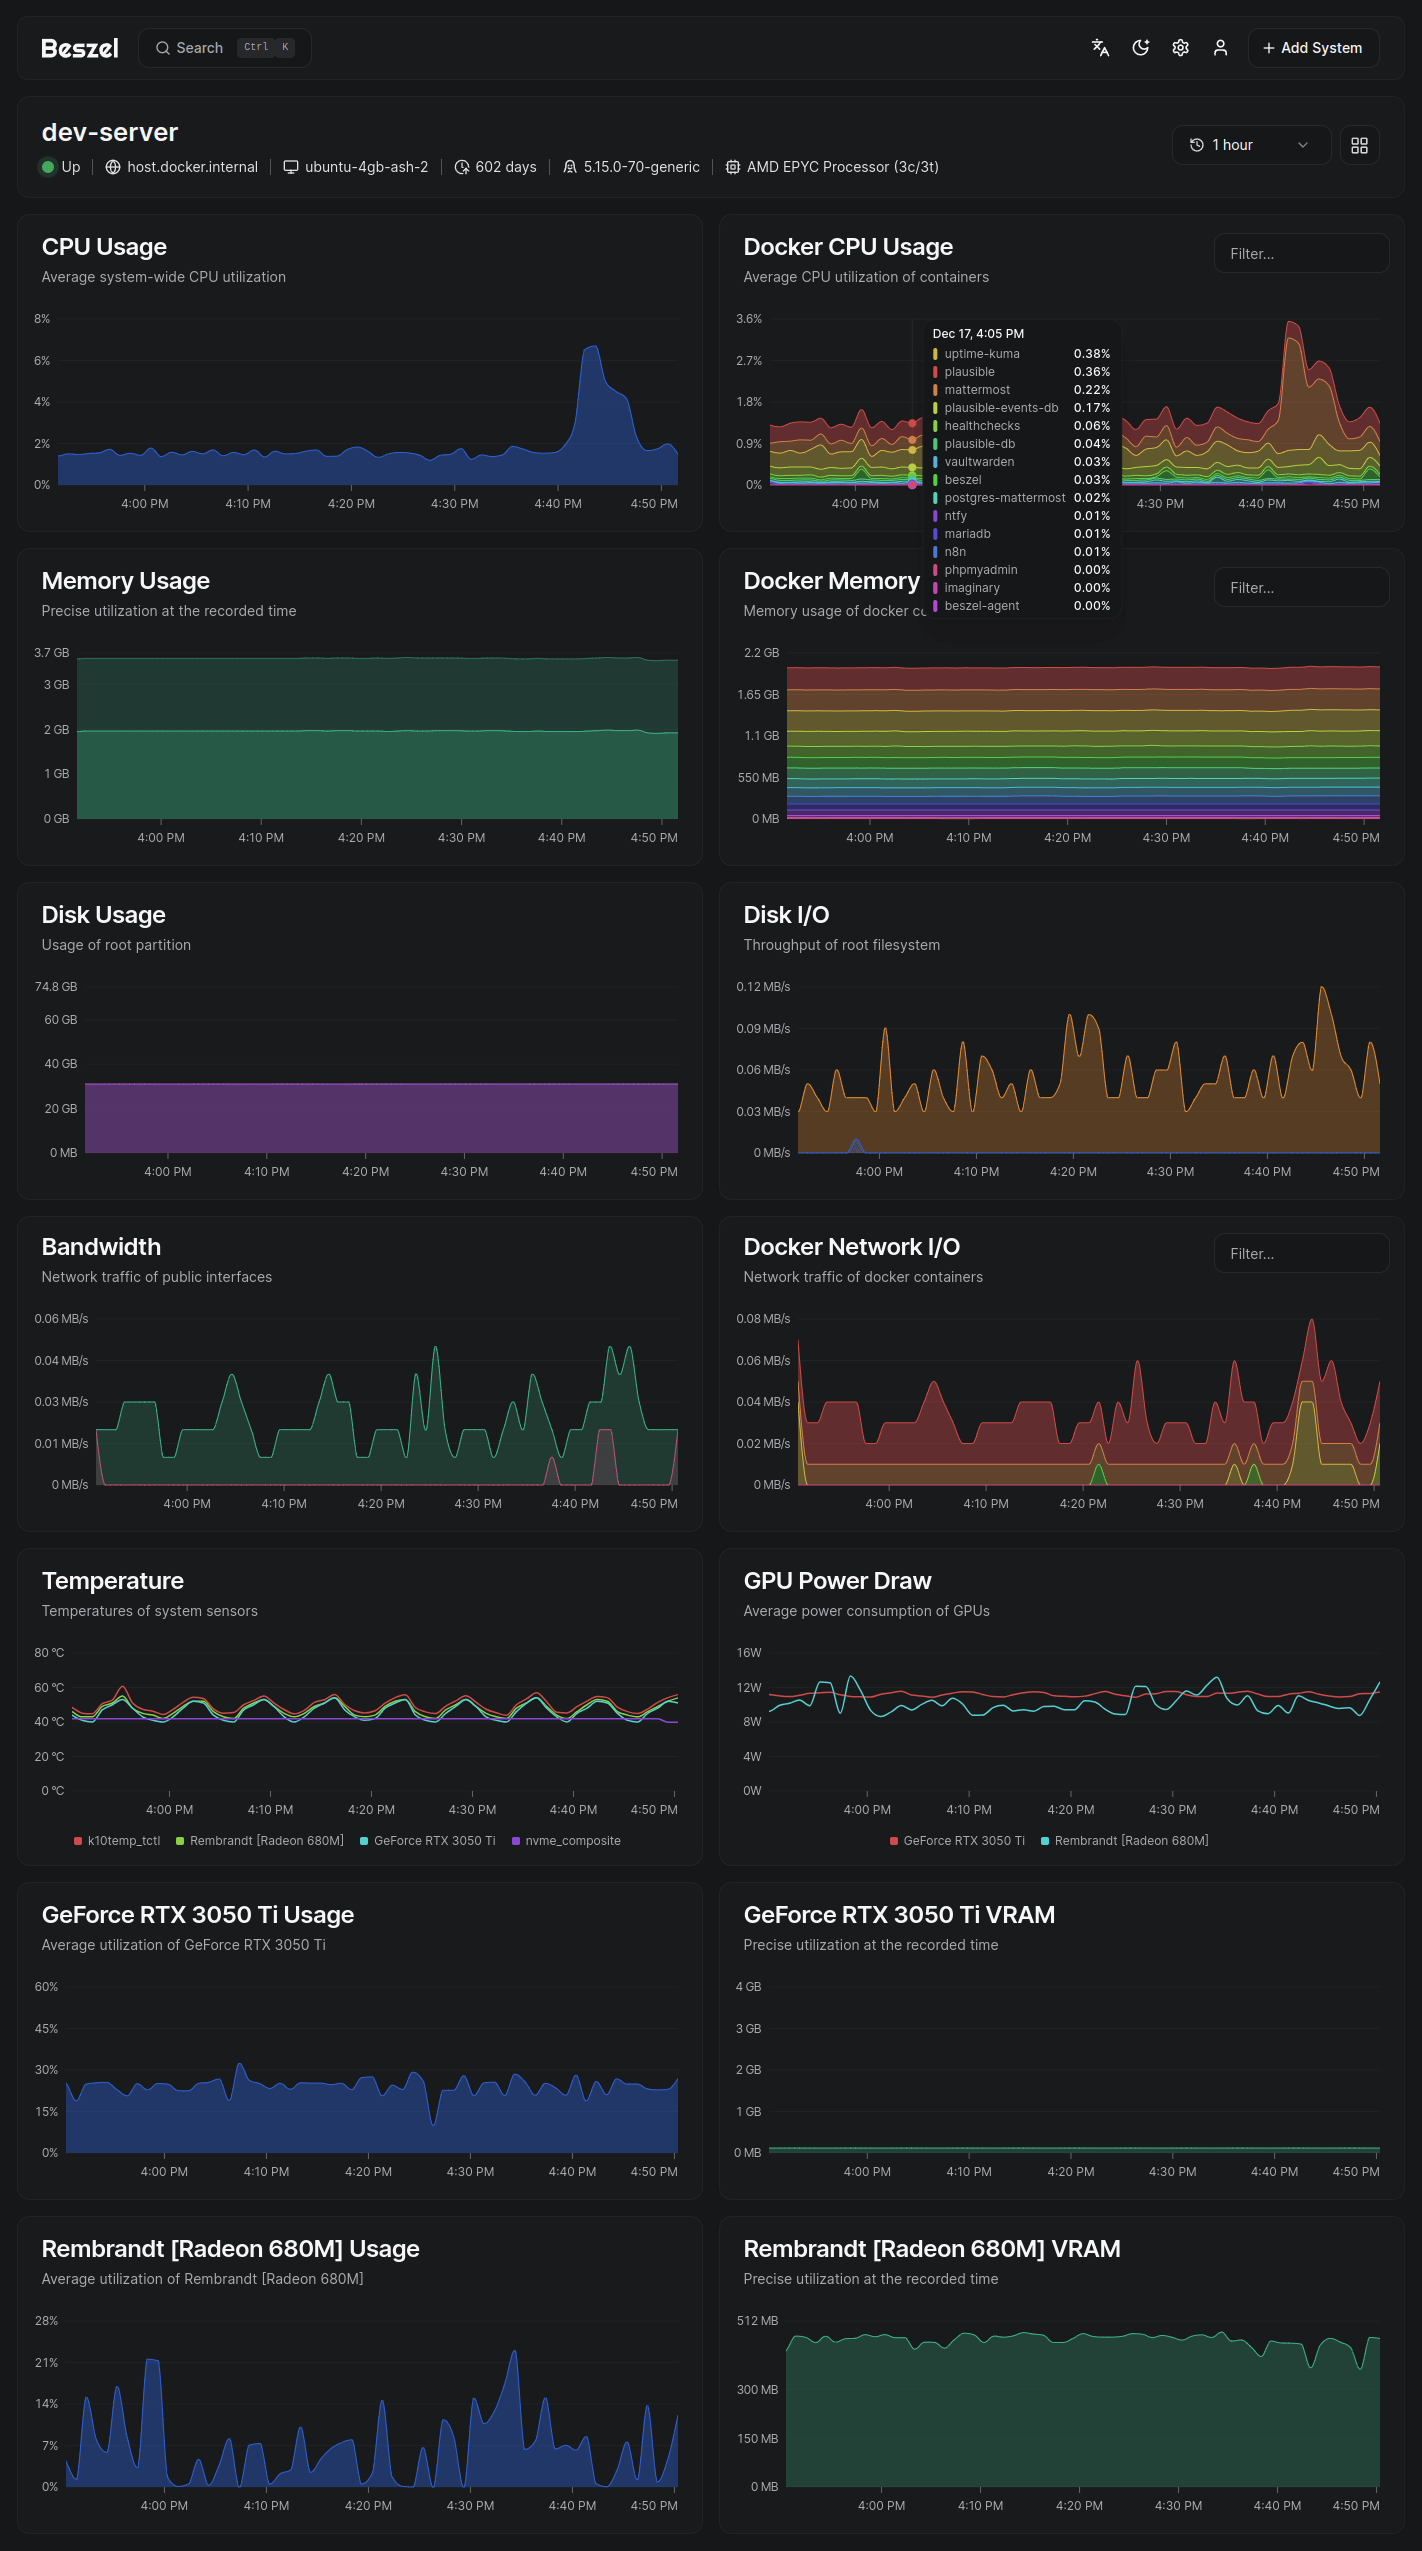 Per-system detail, including disk I/O and containers.
Prometheus + Grafana — the standard metrics stack (self-host)
The de-facto homelab stack. Exporters expose /metrics; Prometheus scrapes and stores them as time-series + evaluates alert rules; Grafana queries Prometheus with PromQL and draws dashboards; Alertmanager routes/dedupes firing alerts to a receiver. Powerful and flexible — and the heaviest to learn and run.
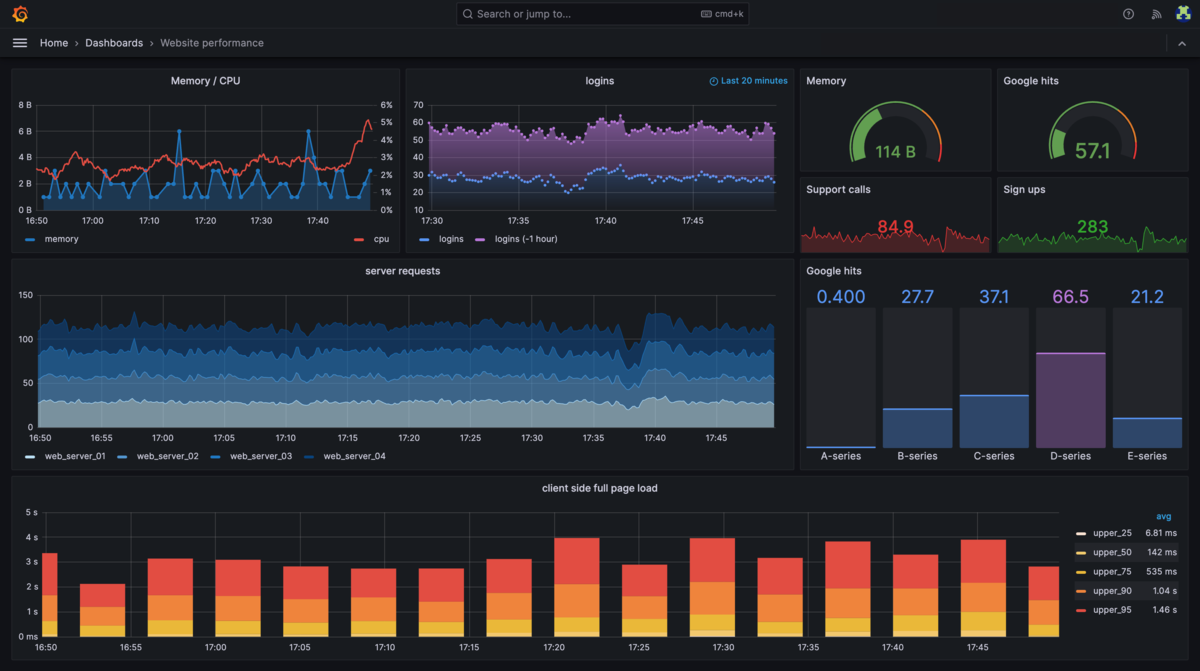 Grafana: dashboards built from PromQL queries against Prometheus.
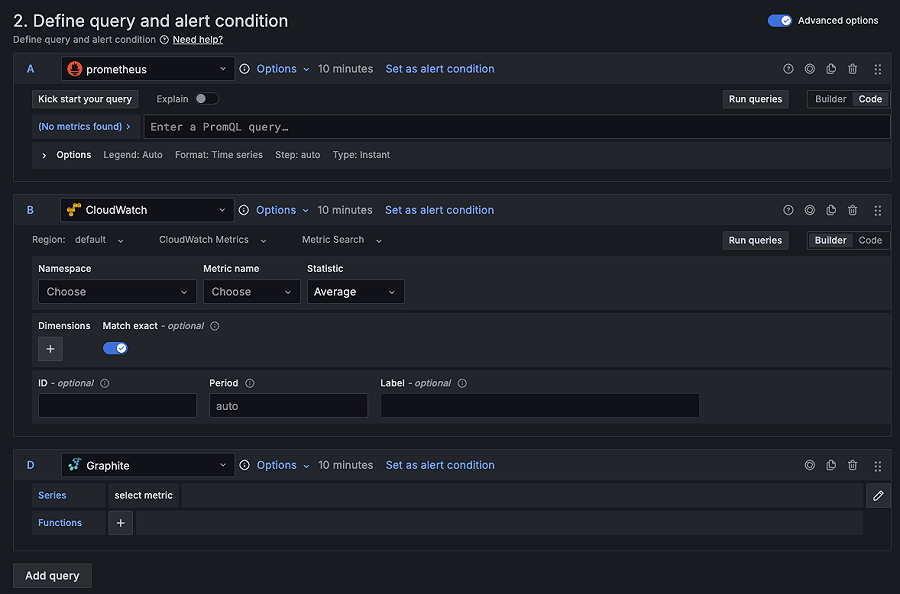 Grafana's alert-rule editor (the flexibility that's also the complexity).
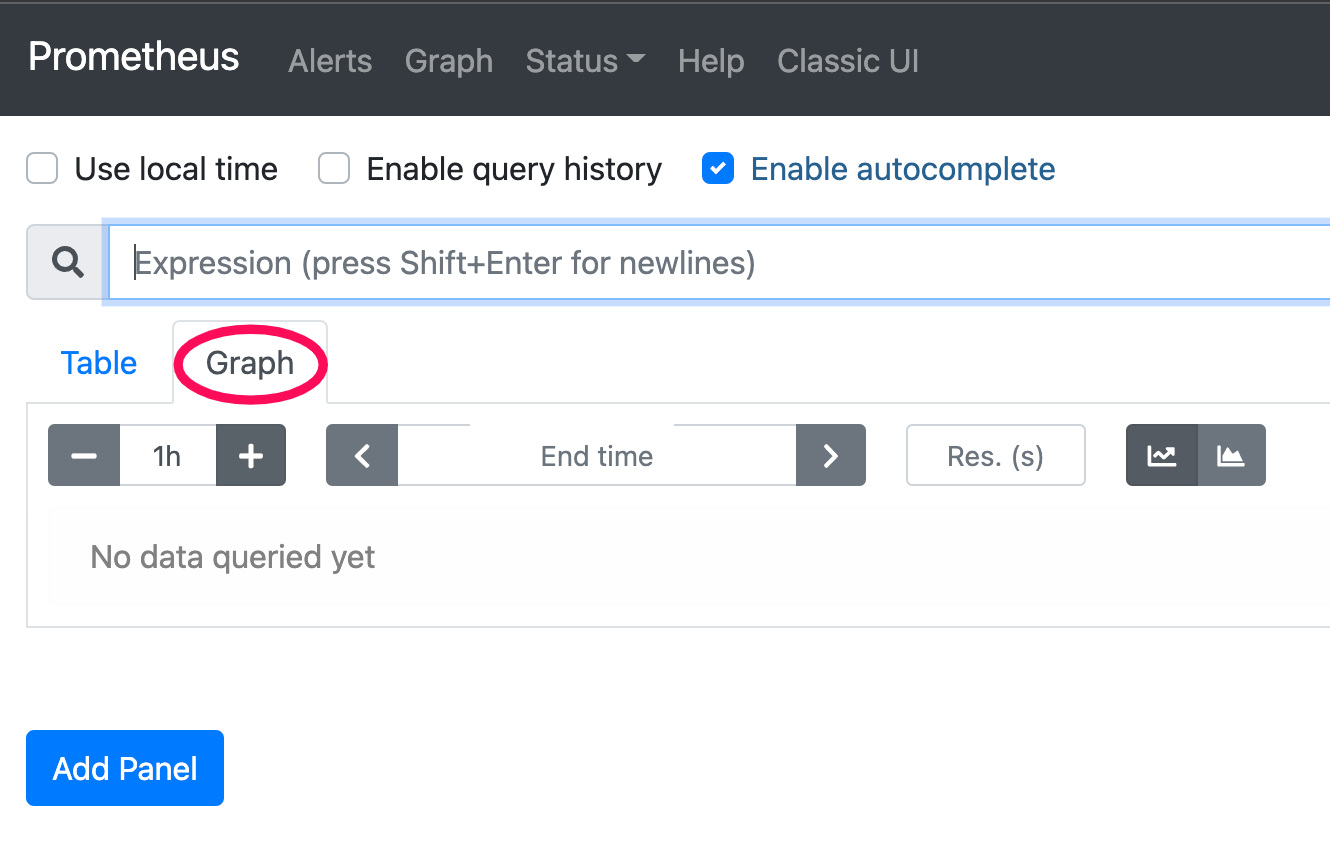 Prometheus' own expression browser — raw PromQL + graph.
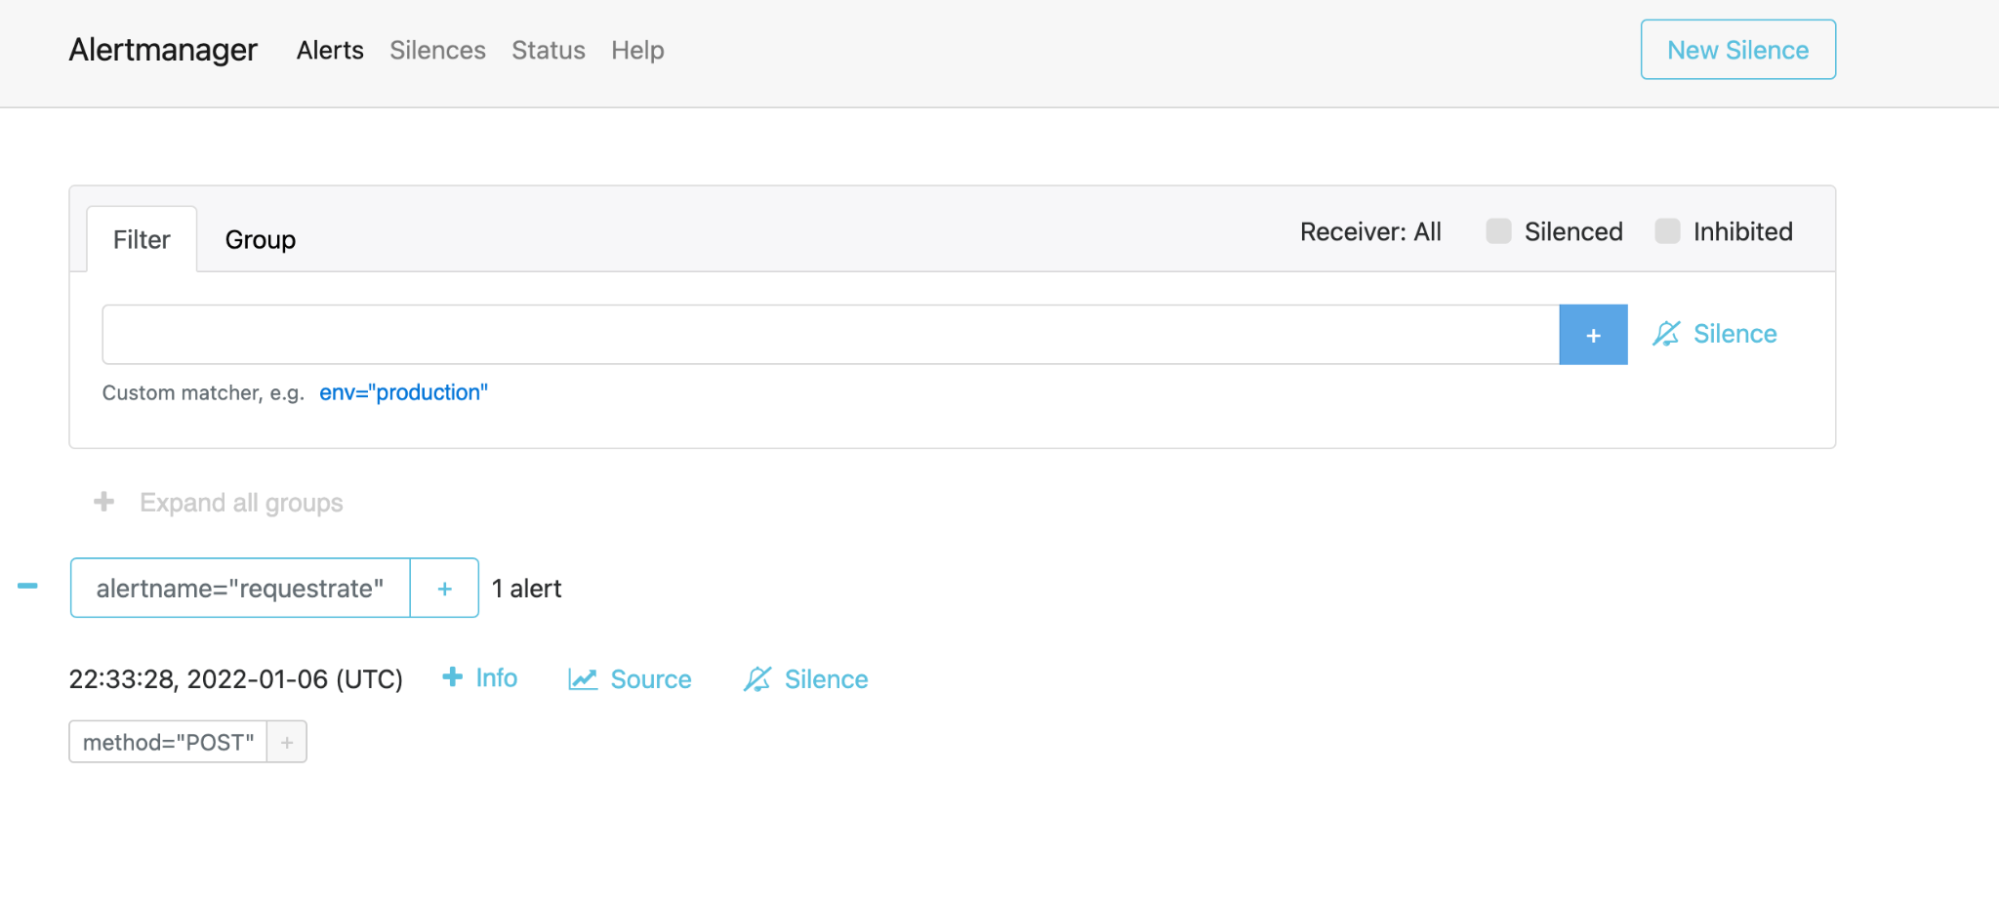 Alertmanager — where firing alerts are grouped, silenced and routed.
Netdata — instant per-node deep metrics (self-host)
An agent per node auto-discovers thousands of metrics at 1-second granularity into a local TSDB, with a zero-config dashboard on :19999 and built-in health + ML-anomaly alerts. Gorgeous out of the box — but heavy on a constrained box (see Avoid).
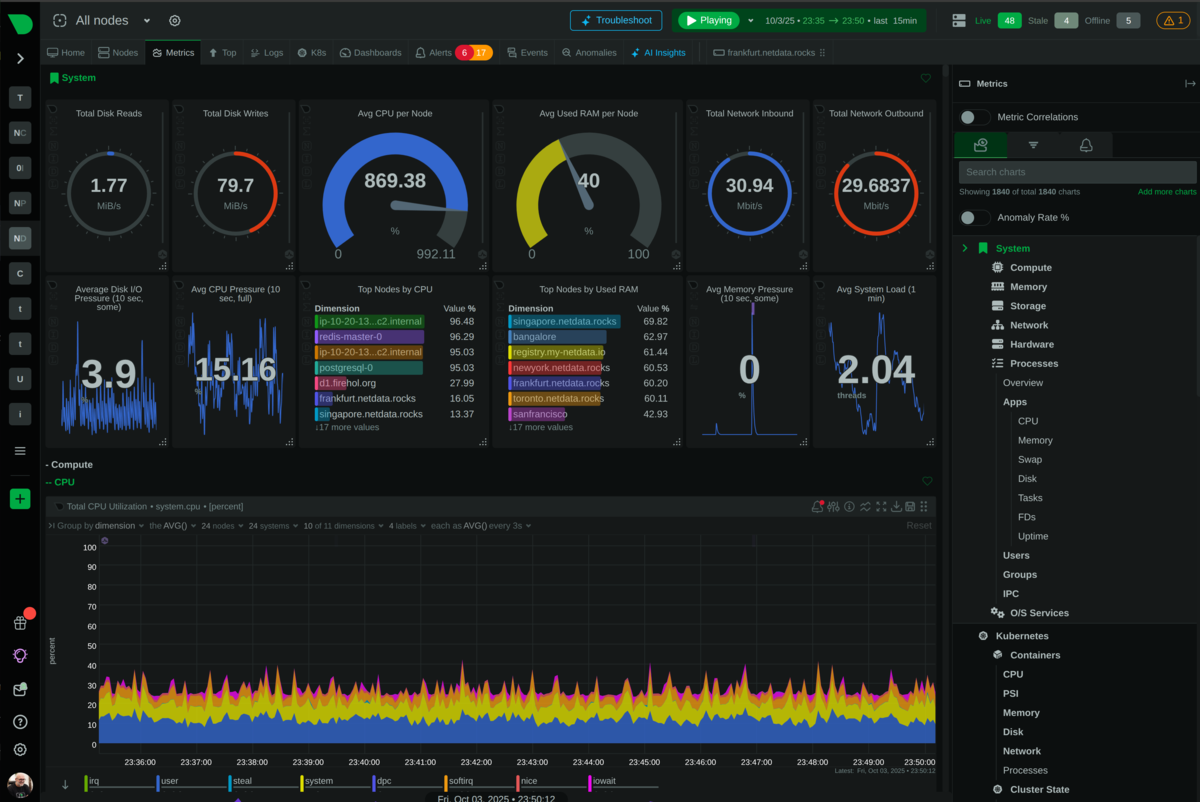 Per-second auto-generated charts — nothing to configure.
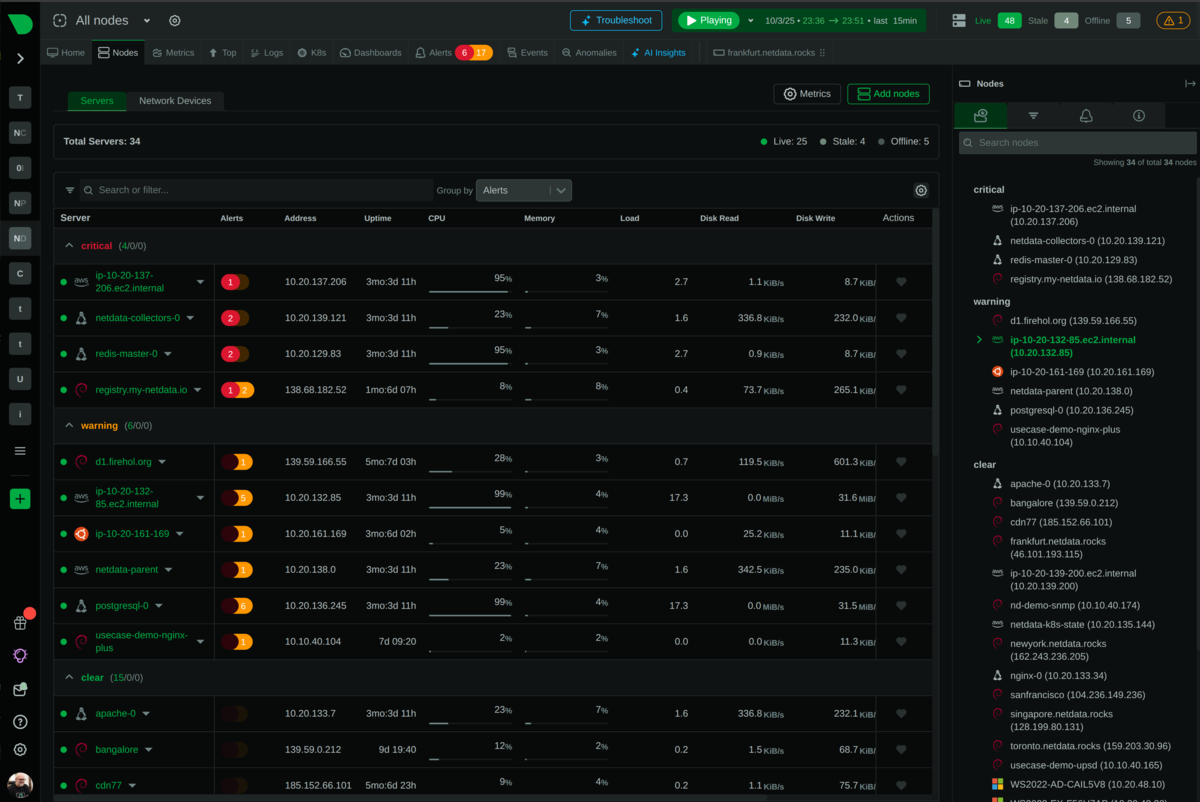 Nodes grouped by alert status (warning/critical).
Axiom — logs + metrics + traces (SaaS)
A managed platform: apps / OpenTelemetry / Vector ship events in, Axiom stores them cheaply in object storage and runs query compute on demand. You explore with APL across logs/metrics/traces together; monitors evaluate on a schedule and notify. Lowest-maintenance (no infra), generous free tier.
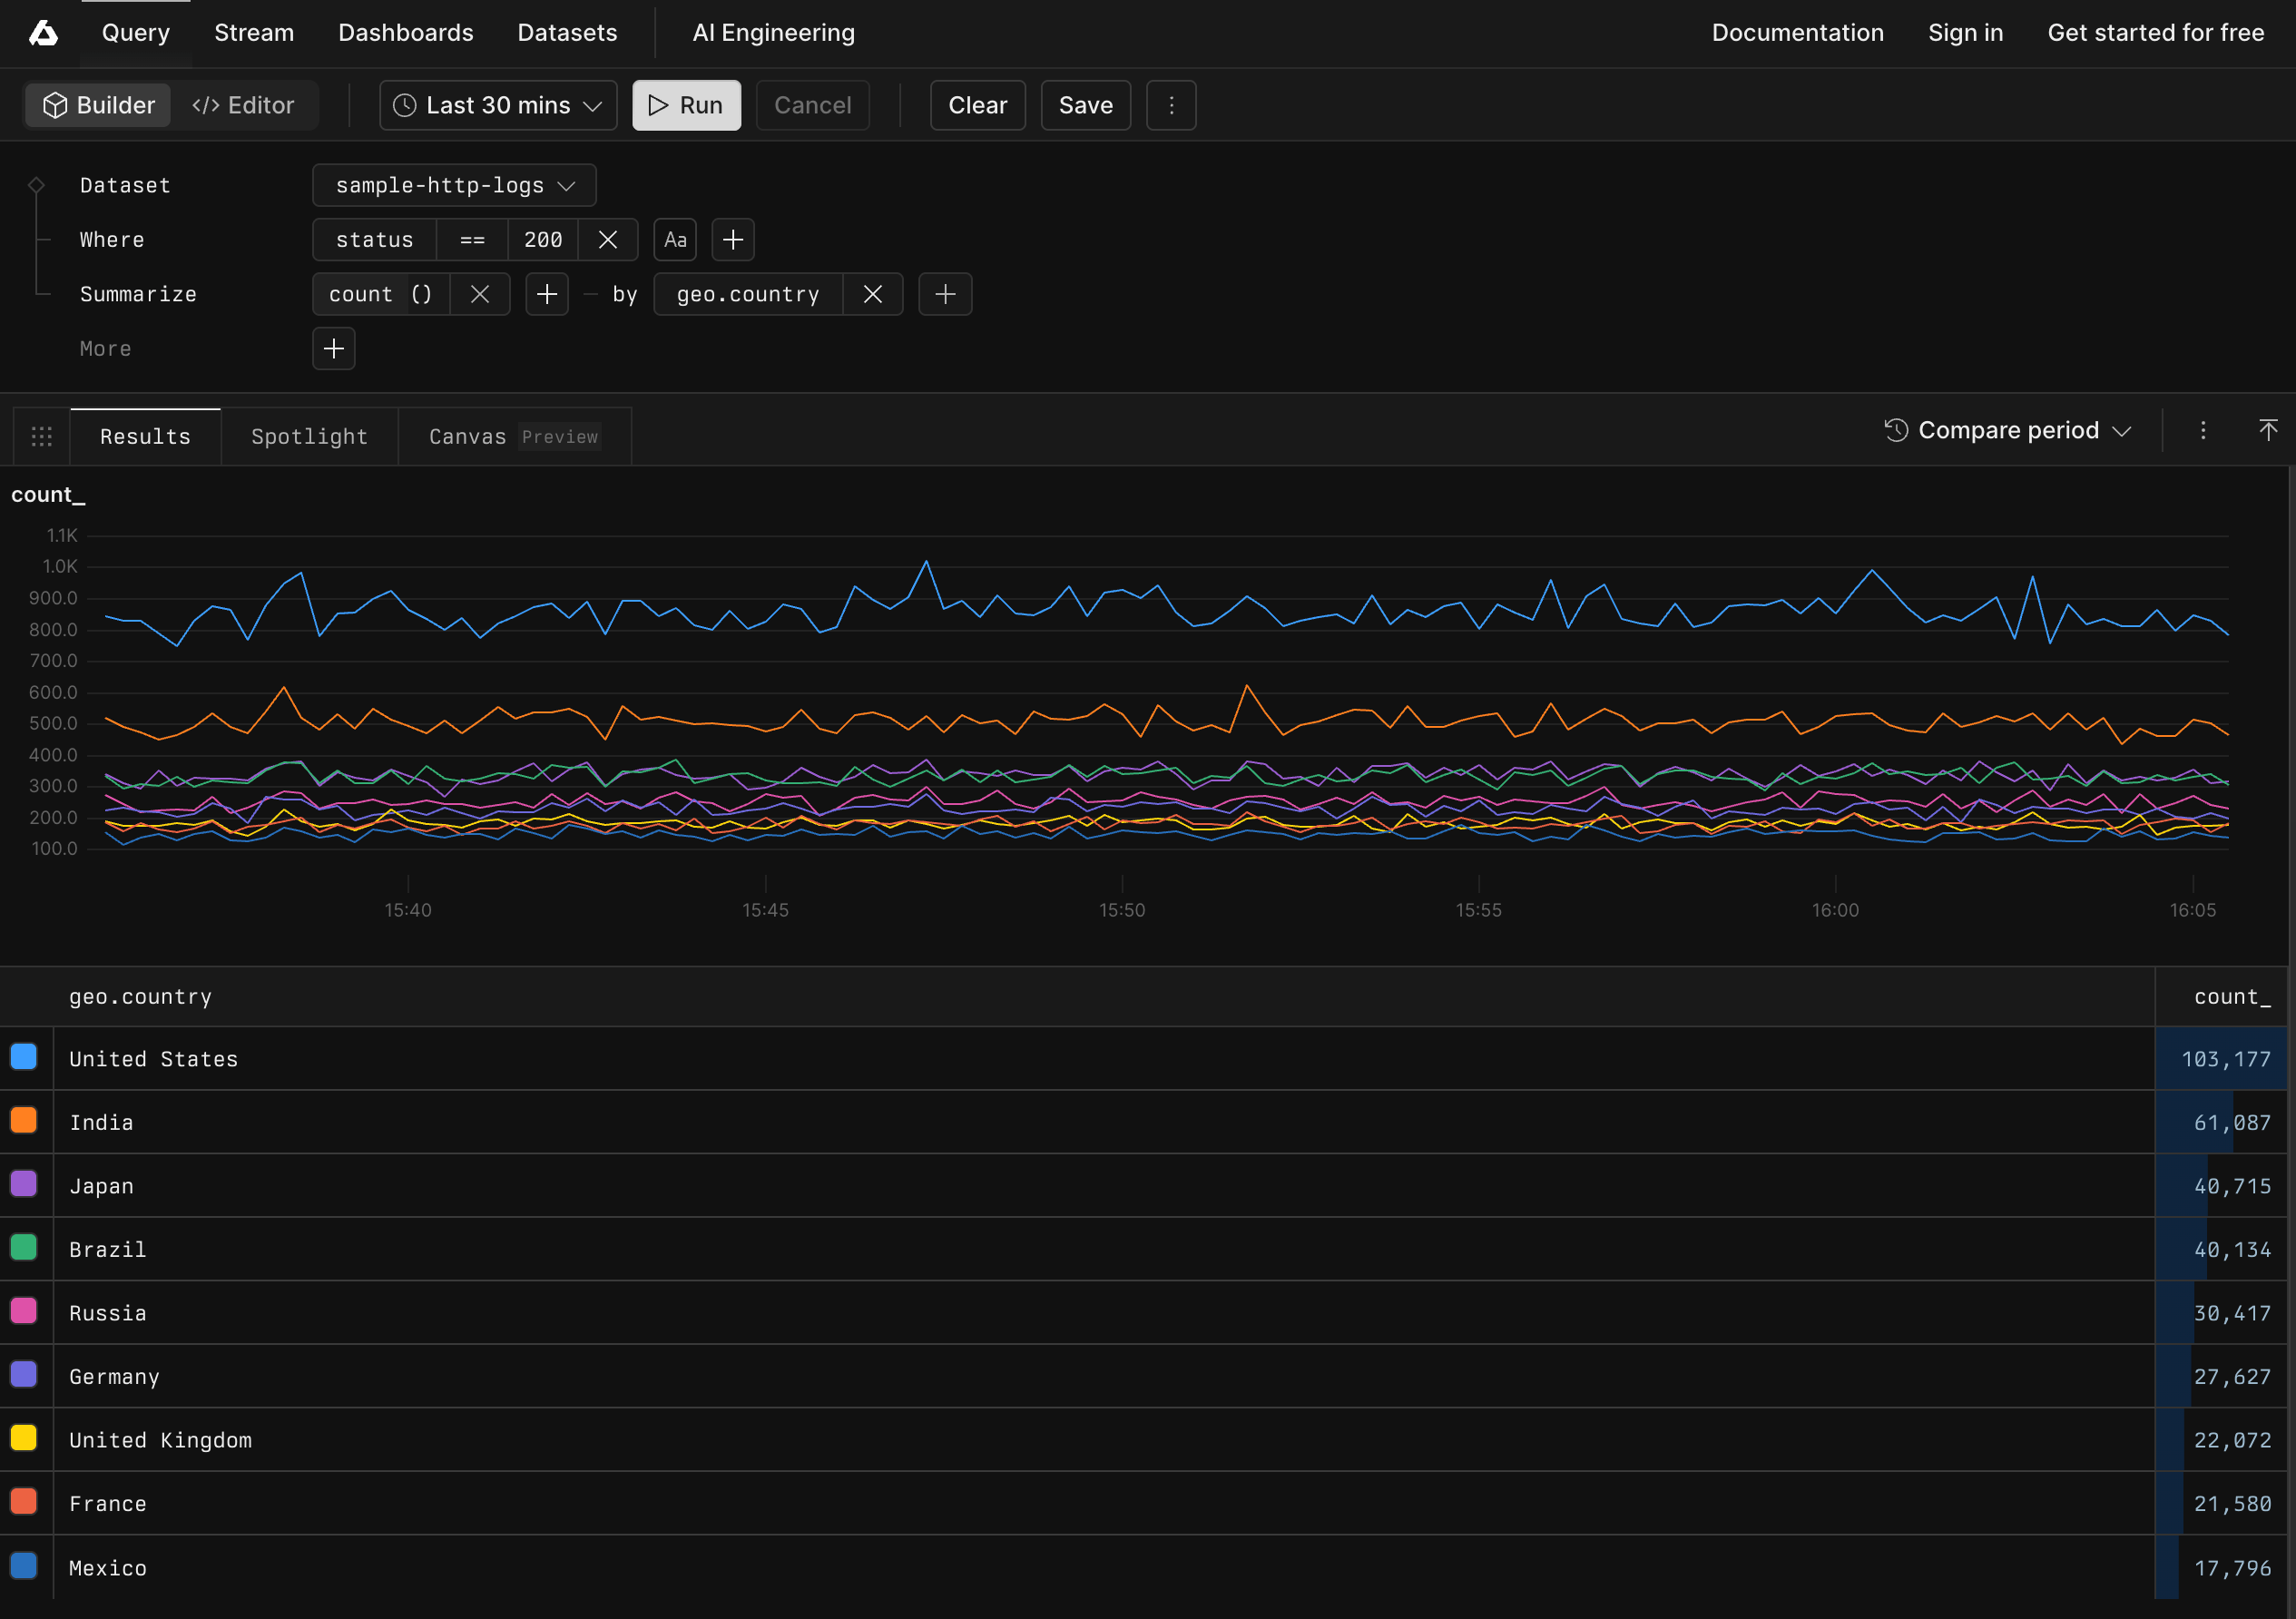 Querying logs in the Axiom console (APL).
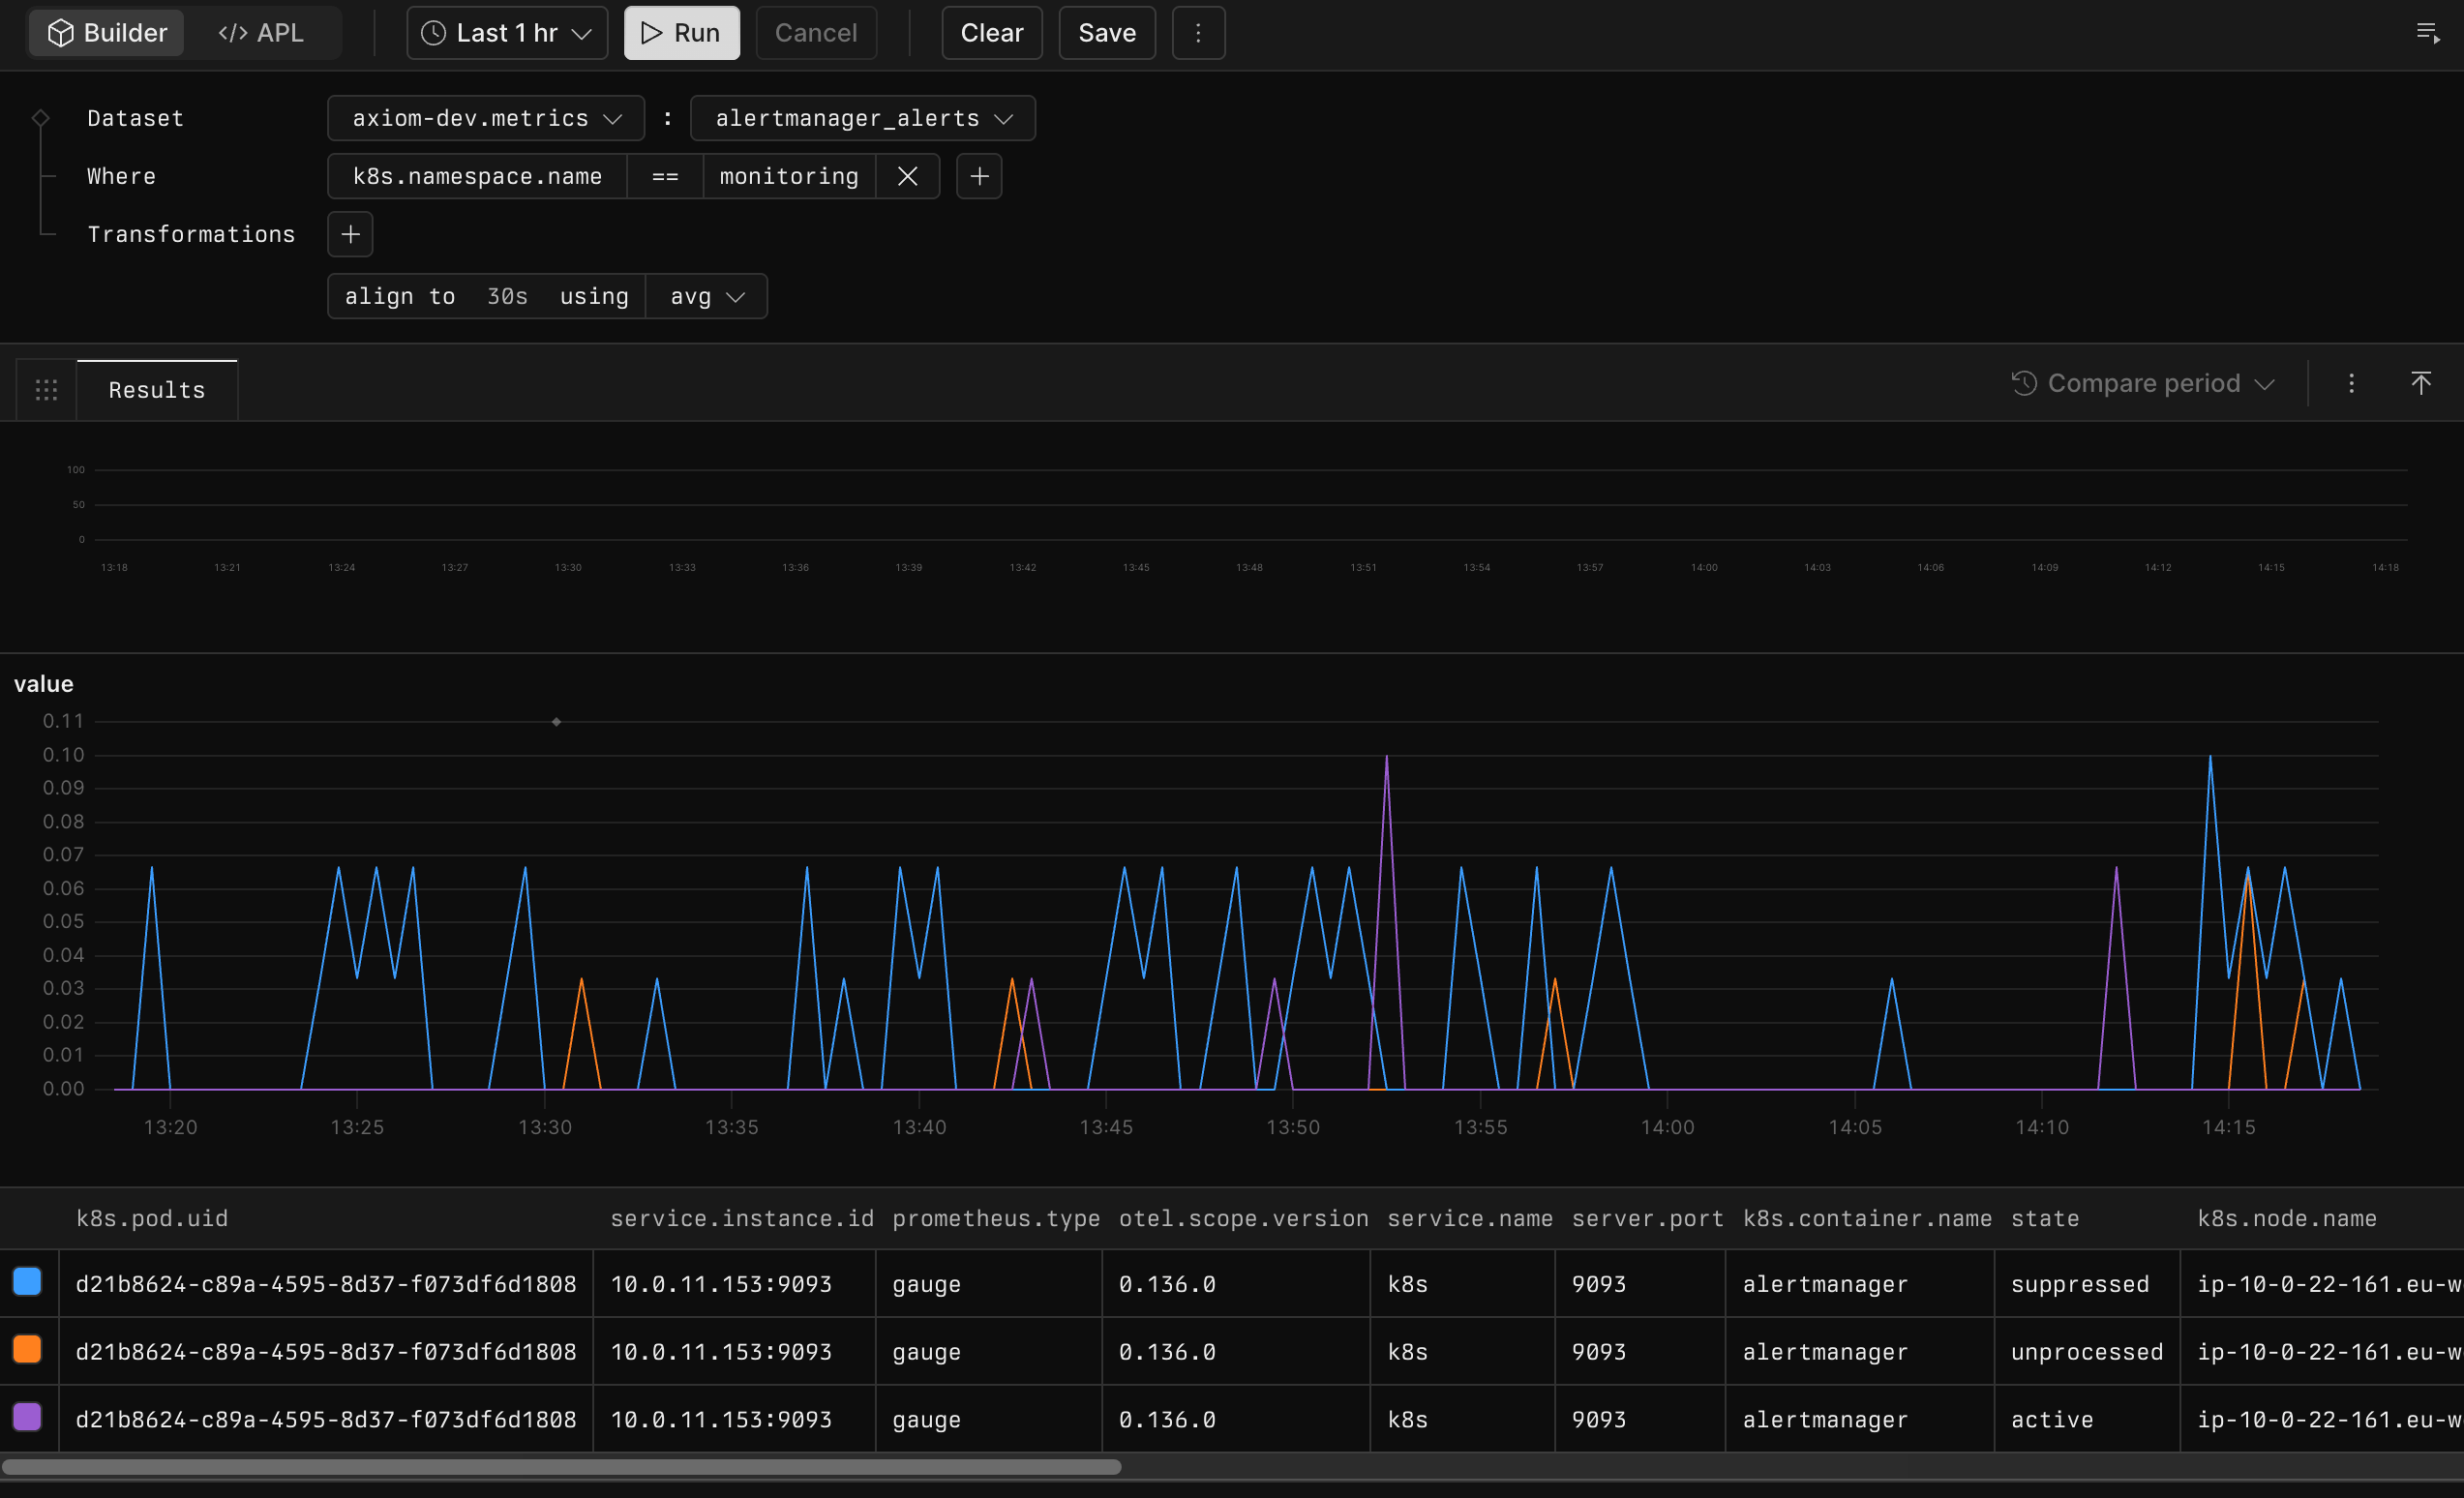 The same console over a metrics dataset.
SigNoz — self-host all-in-one (the Datadog-shaped option)
OpenTelemetry-native: apps emit OTLP → an OTel Collector → SigNoz, which stores everything in ClickHouse and serves APM/traces/logs/dashboards/alerts in one UI. The self-hostable "single tool for all three signals" — at the cost of a ClickHouse-sized footprint.
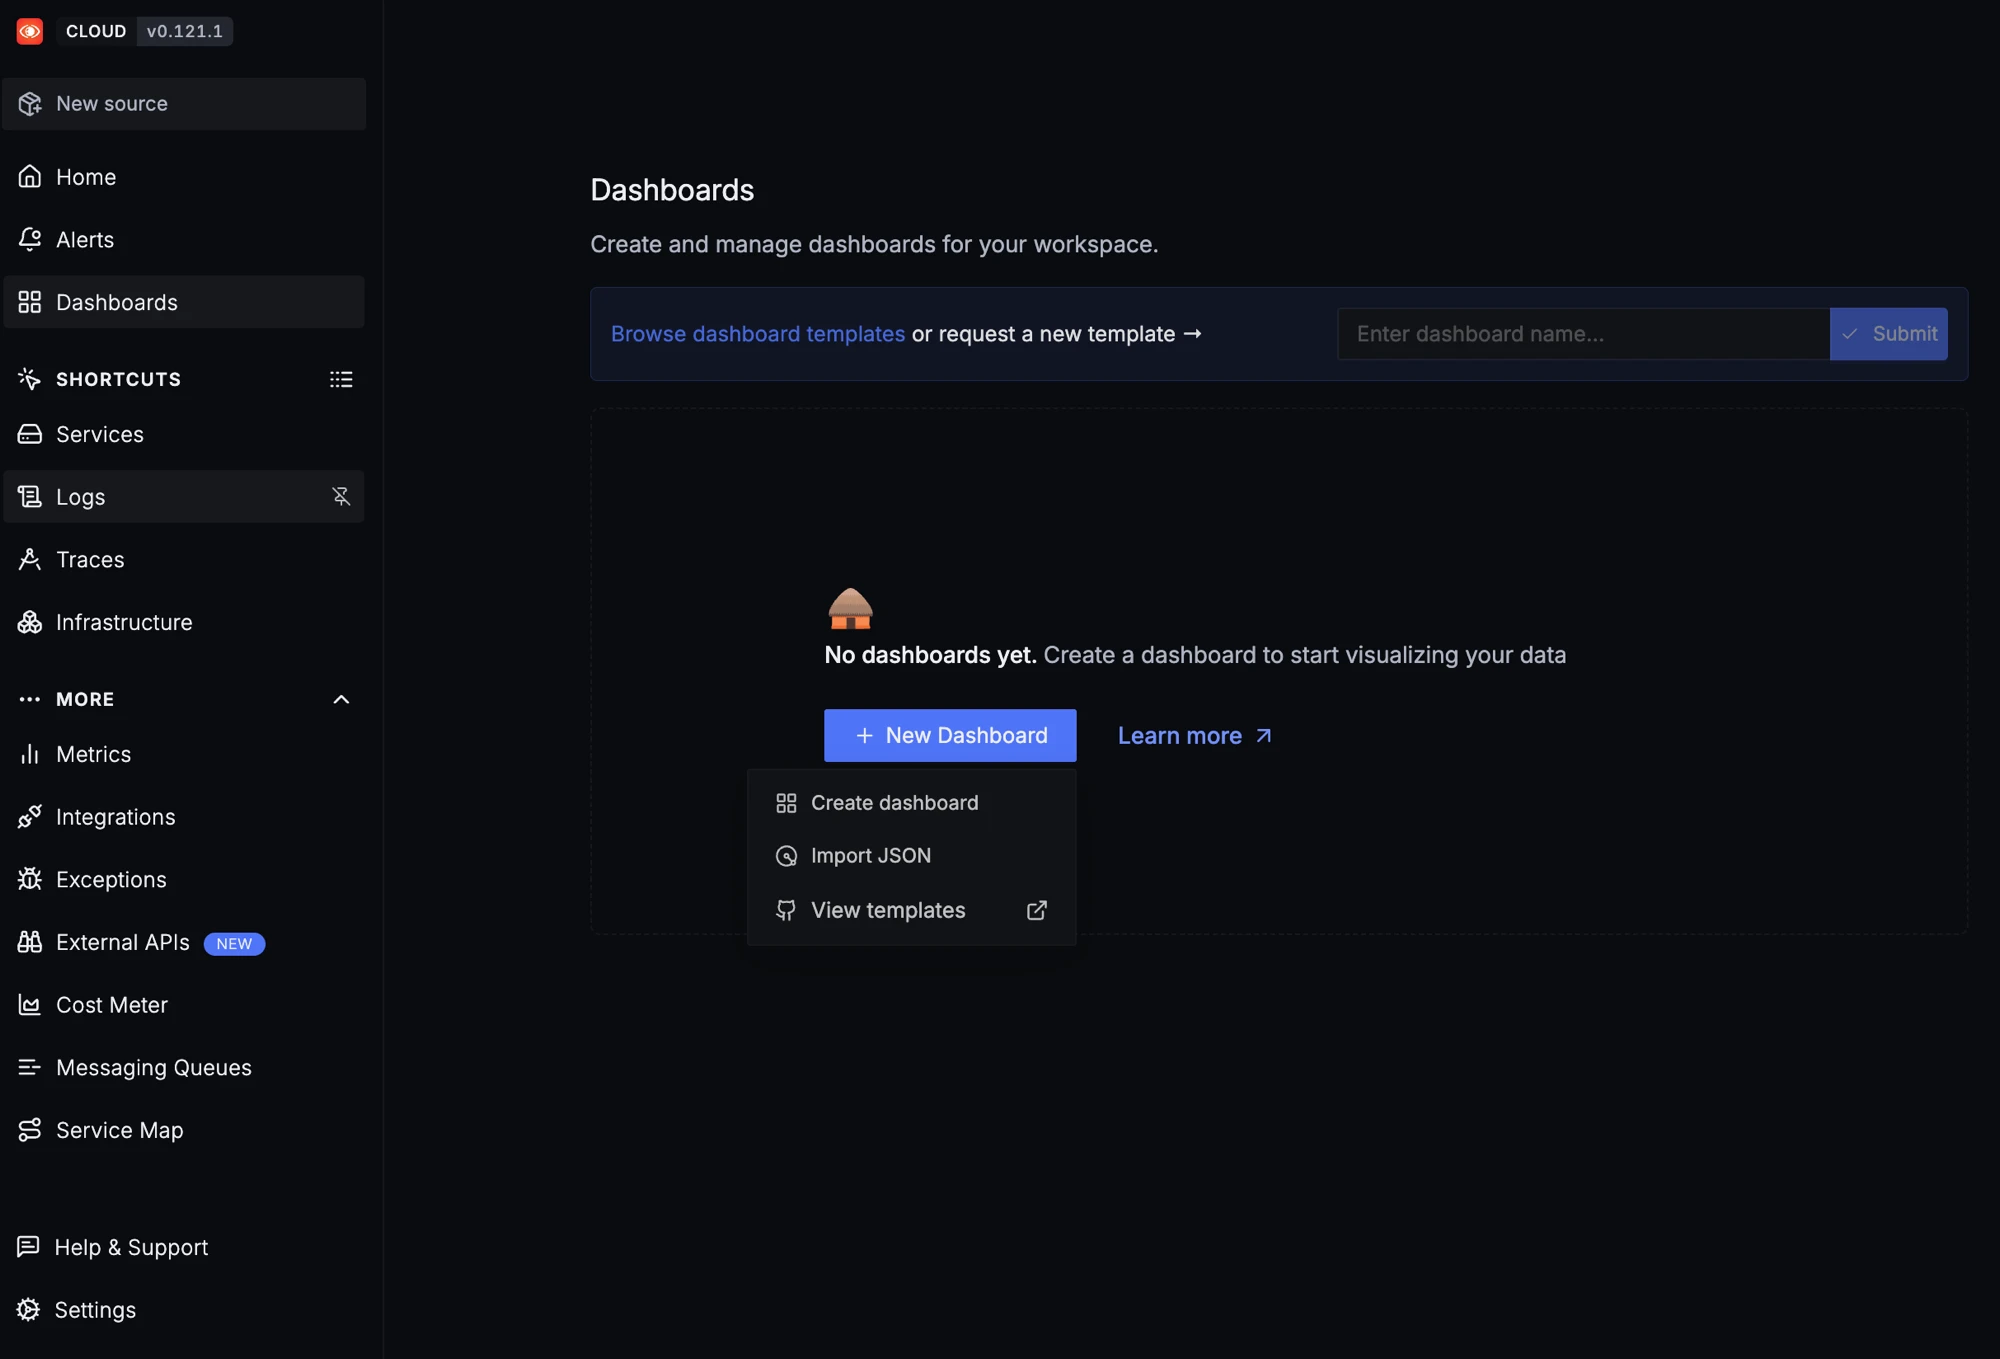 SigNoz dashboards — logs, metrics and traces in one place.
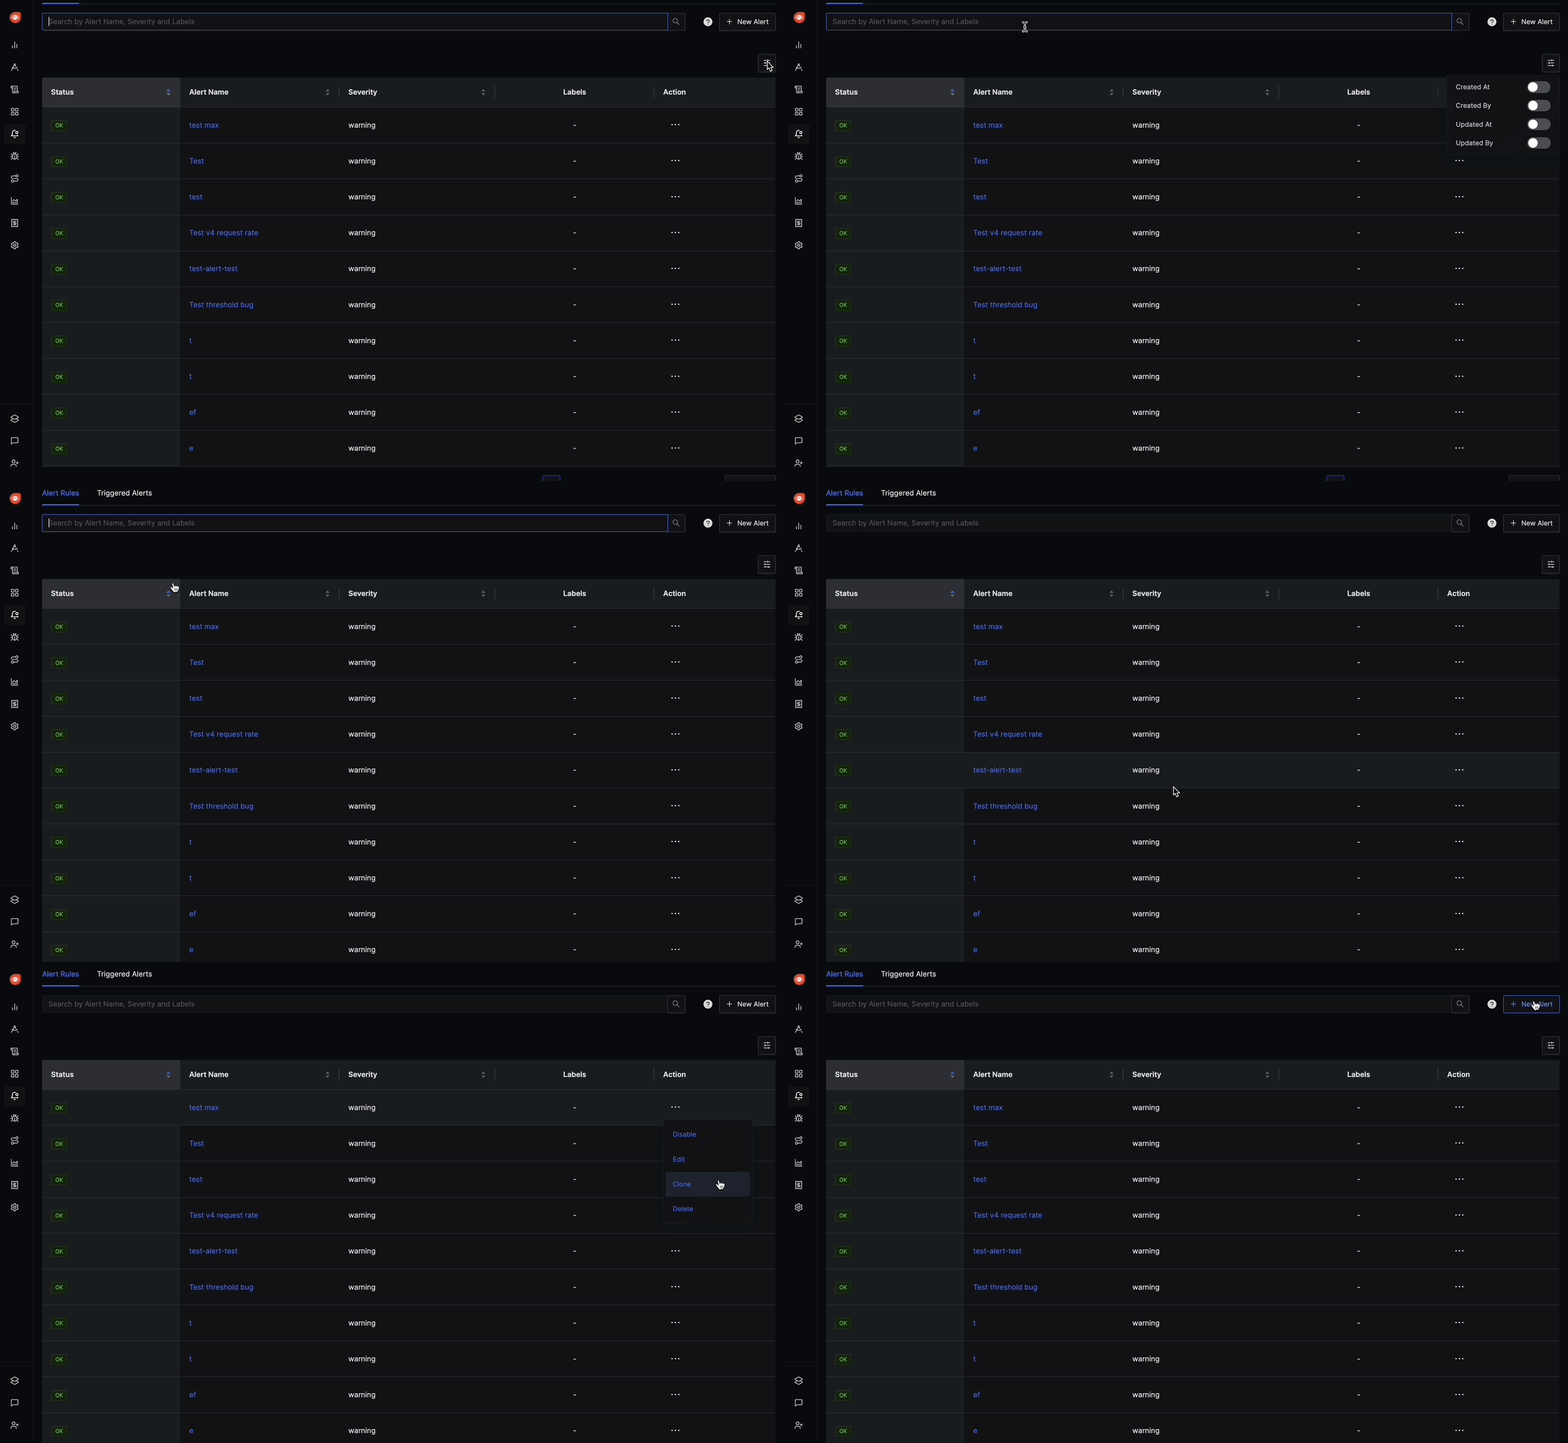 Defining alert rules in SigNoz.
What the metrics look like (CPU over time)
Metrics are levels sampled over time — CPU%, RAM, disk IOPS, load. An agent reads the host, a TSDB stores the samples, a dashboard plots them, and a rule notifies you when a level crosses a threshold for long enough (so a blip doesn't page you, a sustained breach does):
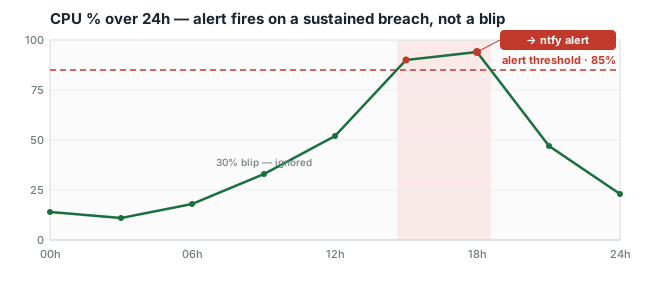
disk IOPS, RAM and load look the same — one series per metric, each with its own threshold. Beszel draws these out of the box; with node_exporter you get them via node_disk_*, node_memory_*, etc.
Dashboards — look vs be told (parallel to alerts)
Alerting is reactive — it tells you once something has already crossed a line. A dashboard is proactive — you go look and catch the disk slowly filling, memory creeping up, or IOPS climbing every night, and fix it before it ever trips a threshold. They're two parallel branches off the same store, and the important part: a dashboard is useful with zero alert rules set. You don't have to configure a single monitor to benefit from "let me just see CPU/RAM/IOPS over the last week".
Which tool gives you a "just go look" dashboard:
Just want to eyeball this box right now, with nothing to run? btop / htop give a live terminal view (no history); glances adds a quick web/REST view. No storage, so no trends — but they answer "what's happening now" in one command.
So if your actual itch is "I want to glance at CPU/RAM/IOPS trends", that's a dashboard need, not an alerting need — reach for Beszel (light) or Netdata (deep, on a roomy box), or Grafana if you want to build your own. Alert rules can come later, or never; the dashboard stands on its own.
NixOS recipe (shape)
Avoid (for this scale + constraints)
- Netdata on a constrained box — its RAM growth is a known, open bug (#16412, recurred on v2.8.2 in Dec 2025); the UI is now proprietary and it was dropped from Debian. Beautiful, but it ate a mini-PC. Use Beszel instead unless you have a roomy box and want the per-second depth.
- Self-hosted Loki alerting — its Ruler leans on WAL replay (no rules evaluate during replay → alerts silently delayed/missed); the documented "fix" adds complexity. This is the "alerting is ungodly complex" trap.
- A 9-service Grafana/Prometheus stack for one cron job — the common over-build. Tier 0 + Tier 1 covers it.
TL;DR — what should I actually do?
Pick the lowest row that covers what you need; everything alerts to whatever channel you like.
The honest default for you: ship Tier 0 + Tier 1 (systemd + Healthchecks) on every box first — an afternoon, and it catches the failures that matter. Add Beszel the moment you want to look at CPU/RAM/IOPS trends (lightweight, dashboard + alerts in one). Reach for Prometheus + Grafana only once you've outgrown that and genuinely want PromQL and the ecosystem — not before.
Further reading
Real writeups this page is grounded in (fetched 2026-06-18):
Footnotes
-
Natsuki — End-to-End Monitoring Explained for Homelabs: Prometheus, Grafana & Alertmanager (2026-01-09) — https://blog.natsuki-cloud.dev/posts/homelab-monitoring-prometheus-grafana/ ↩
-
Dyllan — Deploy a Complete Homelab Monitoring Stack with Docker Compose (2026-02-21) — https://www.nxsi.io/blog/homelab-monitoring-stack-tutorial ↩
-
Ayush Pande (XDA) — This free, open-source lightweight server monitor changed how I keep an eye on my homelab (Beszel) (2025-05-20) — https://www.xda-developers.com/beszel-feature/ ↩
-
Bassim Lazem (BigData Republic) — Effective Cron Job Monitoring (2023-06-14) — https://bigdatarepublic.nl/articles/effective-cron-job-monitoring/ ↩
-
Daniel Pecos Martínez — Homelab monitoring using Grafana and Prometheus (2024-08-29) — https://danielpecos.com/2024/08/29/homelab-monitoring-using-grafana-and-prometheus/ ↩